ImpuseRadar ViewR GPR Software
ViewR – Windows Visualization Software
ImpuseRadar ViewR is a new Windows-based software utility that lets users quickly and easily open and view Raptor data files in an interpolated top-view format without importing them into Condor (3D GPR Processing & Interpretation Software).
The ability to review a Raptor project in this way allows you to check the quality and integrity of your project data while still on-site. This approach will enable you to identify potential issues with the quality of critical positioning data before leaving the project site, possibly saving costly return visits or reruns.
- Excellent tool for managing large Raptor projects
- Zoom into specific areas of a project, cut the desired section, recombine the associated swaths and save it as a sub-project.
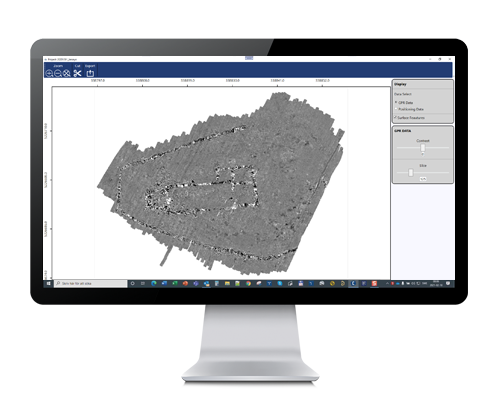

- View and QC GPR and positioning data
- Select/deselect surface features
- Filter GPS quality
- Adjust and set positioning parameters
- Fix GPS/TS offsets
- Scroll time-sliced top view (un-migrated)

ViewR provides an efficient environment for inspecting GPR data and positioning information, helping surveyors verify project quality before moving on to advanced processing and interpretation. It supports data collected with ImpulseRadar 2D systems, including PinPointR, CrossOver, PLT, and RQT, as well as the 3D Raptor GPR array.
The software offers both top-view project visualization and individual radargram inspection. Users can examine survey coverage, review positioning information, adjust display parameters, inspect individual traces, and apply selected data filters.
For Raptor projects, ViewR also provides tools to refine positioning data, exclude unwanted survey swaths, divide large projects into smaller sections, and export prepared datasets to ImpulseRadar Condor for further 3D processing and interpretation.
Key Features
-
Free Windows Software: A proprietary software application provided by ImpulseRadar at no cost.
-
2D and 3D GPR Compatibility: Supports data from PinPointR, CrossOver, PLT, RQT, and Raptor systems.
-
Top-View Data Visualization: Displays GPR survey data in an interpolated project view for convenient inspection.
-
Radargram Visualization: Opens individual profiles and survey swaths for detailed examination.
-
Positioning Quality Control: Provides tools for reviewing and filtering GPS and other positioning data.
-
GPS and Total Station Offset Correction: Allows positioning offsets to be adjusted after data acquisition.
-
Data Filtering: Includes DC, Dewow, Background Removal, Auto Gain, and other display and signal-processing controls.
-
Trace and Spectrum Analysis: Provides access to individual trace characteristics and frequency spectrum information.
-
Project Management: Allows users to exclude unwanted swaths and divide large Raptor projects into smaller sub-projects.
-
Condor Export: Prepares and exports selected project data for further processing in ImpulseRadar Condor.
Supported ImpulseRadar GPR Systems
ViewR supports data files collected using several ImpulseRadar ground penetrating radar systems.
2D GPR Systems
-
PinPointR: Dual-frequency GPR designed for professional underground utility locating.
-
CrossOver: Multi-frequency GPR systems for a wide range of subsurface investigation applications.
-
PLT: Compact GPR systems designed for specialized survey applications.
-
RQT: ImpulseRadar RQT GPR systems.
3D GPR Systems
-
Raptor: Multi-channel 3D GPR array systems designed for large-scale surveys, road investigations, and infrastructure mapping.
The available tools and project workflows depend on the data type and acquisition system used.
GPR Data Visualization
ViewR provides two main ways to inspect GPR data: the project top view and the radargram view.
Top-View Project Visualization
The top-view interface displays the survey data across the project area, allowing users to review the spatial distribution of recorded GPR information.
The interface supports:
-
Zooming into specific survey areas.
-
Navigating large projects.
-
Scrolling through time slices.
-
Adjusting the displayed depth range using the depth controls.
-
Changing the assumed radar wave velocity for depth visualization.
-
Displaying GPR data and positioning information.
-
Viewing project coordinates, including UTM coordinates and geographic coordinates when available.
-
Measuring distances directly within the project view.
The top view is particularly useful for reviewing survey coverage and identifying areas that may require additional inspection.
Radargram View
The radargram interface allows users to open and inspect individual GPR profiles or swaths.
It provides detailed visualization of recorded radar signals and includes controls for:
-
Selecting survey swaths and antenna channels.
-
Navigating individual profiles.
-
Adjusting zoom and display scaling.
-
Viewing time and depth scales.
-
Comparing multiple profiles and projects.
-
Displaying individual channels or multiple channels simultaneously where supported.
-
Synchronizing the radargram with the corresponding time-slice view.
For CrossOver and PinPointR data, users can navigate between profiles and inspect the available high-frequency and low-frequency data views.
Positioning Data Quality Control
Accurate positioning is essential for producing reliable GPR survey maps, particularly in large-area and 3D surveys.
ViewR includes several tools for reviewing and adjusting positioning information before exporting data to Condor.
GPS Position Filtering
The GPS Status Filter allows users to select which GPS fix-quality statuses should be retained in the project.
This is useful for identifying and excluding positioning records that do not meet the required survey-quality criteria.
Angle Filter
The Angle Filter identifies positioning points that create sharp or irregular turns in the survey path. Selected points can be removed to improve the continuity and consistency of survey tracks.
Minimum Distance Filter
This filter removes positioning points that are too close to neighboring points according to a user-defined minimum distance.
It can help reduce unwanted clusters of positioning records, particularly when the survey system slows down or temporarily stops.
GPS and Total Station Offset Correction
ViewR allows users to adjust GPS antenna or Total Station prism offsets after data acquisition.
This function is useful when a positioning offset was not correctly configured during the original survey or when an adjustment is required during data quality control.
Total Station Delay Compensation
For projects using Total Station positioning, ViewR provides delay compensation options to address timing differences between coordinate measurements and GPR data acquisition.
The available options include automatic and manual delay compensation, as well as the option to disable compensation.
Importing External Positioning Data
ViewR supports importing alternative positioning data from CSV files for compatible workflows.
The software documentation specifically describes compatibility with CSV trajectory files exported from the Trimble MX9 system. The imported positioning data can be compared with the original project positioning information before export.
GPR Signal Visualization and Analysis Tools
ViewR includes several tools for examining radar signals and adjusting their presentation.
Data Filters
The available data filters include:
-
Auto Adjust Zero Level: Aligns the starting points of radar traces to a common zero level.
-
DC Filter: Removes constant signal offsets from radar traces.
-
Dewow Filter: Reduces slowly varying low-frequency offsets in the recorded signals.
-
Background Removal: Reduces recurring signal patterns shared across multiple traces, which can help improve the visibility of certain subsurface features.
Background removal should be used carefully because it may also suppress continuous horizontal reflections, such as geological layers.
Display Filters and Gain Controls
The software provides several visualization controls:
-
Auto Gain
-
Linear Gain
-
Exponential Gain
-
Manual Contrast Adjustment
-
Soil Velocity Settings
These controls help users adjust the appearance of radargrams and examine signal reflections at different depths.
Soil velocity settings are particularly important when converting recorded two-way travel time into an estimated depth scale. The selected velocity should reflect the actual survey material as closely as possible.