Prism2 GPR Software – Data Acquisition and Processing Software
Prism2 is professional Ground Penetrating Radar (GPR) software developed for controlling georadar parameters, acquiring and displaying radar data in real time, recording survey files, and processing GPR data. The software provides an integrated environment for field data acquisition, visualization, analysis, and reporting.
Prism2 software is designed for georadar parameter control, sounding data reception with simultaneous computer display and hard disc file record as well as for file processing and printout.

Prism2 supports both continuous profile acquisition and stepped stacking. Continuous acquisition provides high horizontal resolution, while stepped stacking can be used to increase investigation depth and support specialized applications such as GPR tomography. The software also supports GPS positioning, measuring-wheel integration, profile marking, digital gain adjustment, and real-time visualization during surveys.
The software provides a range of visualization and processing tools, including color and grayscale radar profiles, wiggle plots, frequency spectra, velocity and depth evaluation, bandpass filtering, amplitude correction, migration, envelope processing, topography correction, and X-interpolation. Prism2 also supports SEG-Y and Radar Systems data formats and allows processed results to be exported as Bitmap or JPEG images.
What is Prism2?
Prism2 is a professional GPR software package designed for operating compatible Ground Penetrating Radar (GPR) systems, collecting radar data, and processing and interpreting GPR profiles. It provides a complete working environment in which the operator can control radar parameters, monitor data acquisition in real time, save survey data, and apply a range of digital processing tools.
The software is designed to work as an integrated component of the Zond, Python, and xGPR families of georadar systems. During field surveys, Prism2 allows the operator to configure the radar, acquire data continuously or using stepped stacking, and view the resulting profile directly on a computer. GPS positioning and distance measurement using a survey wheel can also be used to associate GPR data with the survey path.
Beyond data acquisition, Prism2 provides tools for improving and analyzing GPR profiles. These include digital gain, frequency bandpass filtering, amplitude correction, migration, envelope processing, topographic correction, X-interpolation, spectral calculations, and velocity and depth evaluation. The software also supports multiple display modes and a multi-window environment for comparing profiles and processing results.
In practice, Prism2 serves as the main interface between the operator and the GPR system, covering the workflow from field data acquisition to initial processing and interpretation of subsurface radar data.
Key Features
- GPR parameter control and data acquisition
- Real-time radar data visualization
- Continuous and stepped stacking modes
- Digital gain adjustment
- GPS tracking and NMEA-0183 support
- Measuring-wheel integration and X-interpolation
- Color and grayscale radar profiles
- Wiggle plot visualization
- Frequency spectrum analysis
- Velocity and depth evaluation
- Bandpass filtering
- Amplitude correction
- Migration and envelope processing
- Topography correction
- SEG-Y and Radar Systems data support
- Bitmap and JPEG export
- Multi-language user interface
- Windows 7, 8, 10, and 11 support
GPR Data Processing
- Background Removal
- Bandpass Filtering
- Gain / Amplitude Correction
- Migration
- Envelope
- Topography
- X-Interpolation
- Moveout Correction
- Time-to-Depth Conversion
Prism2 in a GPR Survey Workflow
Prism2 can be used throughout several stages of a GPR survey, from initial radar configuration and field data acquisition to profile visualization and data processing.
During fieldwork, the operator can configure the available georadar parameters, select the appropriate acquisition mode, monitor the radar profile in real time, and record the survey data. GPS positioning and measuring-wheel information can also be used to associate radar measurements with their position along the survey line.
After data acquisition, the recorded profiles can be reviewed and processed using the available visualization and processing functions. Depending on the survey objective and data quality, the operator can apply filtering, gain and amplitude correction, migration, envelope processing, topographic correction, and other processing techniques to improve the interpretation of subsurface features.
This workflow makes Prism2 useful not only as a GPR data acquisition interface, but also as a practical environment for the initial processing and analysis of collected radar profiles.
System Requirements:
- Windows 7/8/8.1/10
- CPU Core i3
- 4 GB RAM
- Ethernet 10/100 BaseT or WiFi card
The language of communication (English, German, Greek, Korean or Russian) is chosen by a user, with a language changeover possible at any time.
All of the georadar parameters (except the on/off function) are controlled via a computer which facilitates operation of the hardware. In the course of tuning the radar and performing the sounding, the software outputs error messages if parameter settings are incorrect, and suggests proper steps to be taken. Useful keyboard-oriented interface for georadar management and data acquisition. You don't need touch mouse (trackball, touchpad...) on your Notebook when work in field condition.
Georadar data reception may be performed continuously (basic mode) or with stepped stacking. The continuous reception mode enables maximum spatial (horizontal) resolution. Stepped stacking is used to achieve possible maximum sounding depth and to solve special tasks (tomography, etc.) while requiring a longer sounding time.
To locate a sounding profile obtained, the operator may press a pushbutton to input the so-called 'marks' when passing through stations or any reference points. These marks will be displayed on the profile as vertical lines with respective numbers at the top. Upon completion of the sounding (or any time later), it is possible to input a text comment into the file to indicate the sounding area, the sounding target, and the like.

3D-cube of underground pipes with the slice
DATA COLLECTION:
- Colored or grayscale acquisition mode
- Continuous profile or stepped mode
- Digital gain function applying
- Record of current coordinates from GPS receiver in NMEA-0183 format with a real-time GPS Tracking possibility
- Distance measurement from wheel and real-time wheel X-interpolation
DISPLAY MODE:
- user selected color or grey scale line scan, wiggle plot
- integrated multi-windows environment
- user-friendly interface
- Different data formats: SEG-Y, Radar Systems
- spectra calculations in arbitrary windows
- output to printer supported by Windows
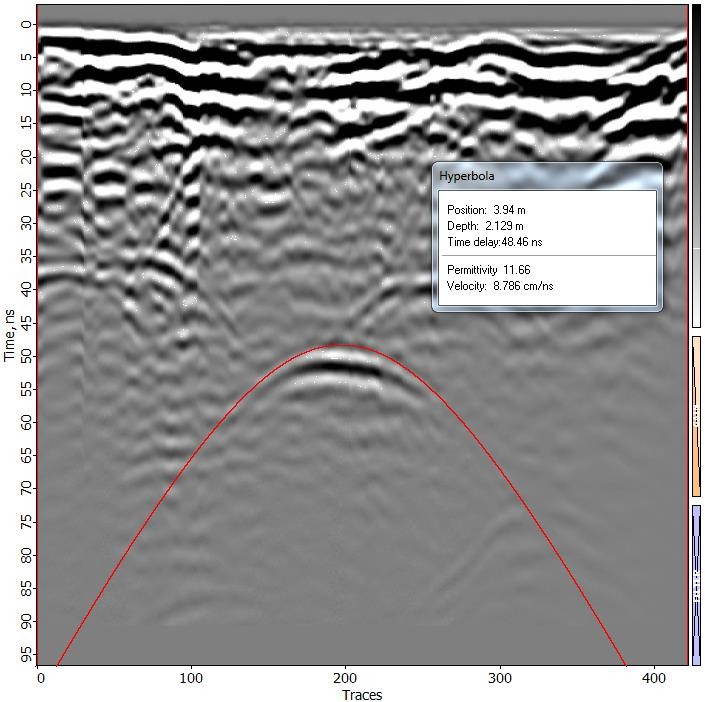
- velocities and depth evaluation via diffracting options
- 10 point digital gain function
- GPS Tracker tool for GPS coordinates
- Stepped Zoom In & Zoom Out
- Unlimited Undo & Redo functions for a data processing
- Export to Bitmap & JPEG possibilities
- Hodograph calculations
PROCESSINGS:
- frequency bandpass filters
- efficient amplitude correction
- migration & envelope
- topography
- x-interpolation
Downloads:
To download Prism2 software click here...